
Tracking Usage of the 1 North Study Room
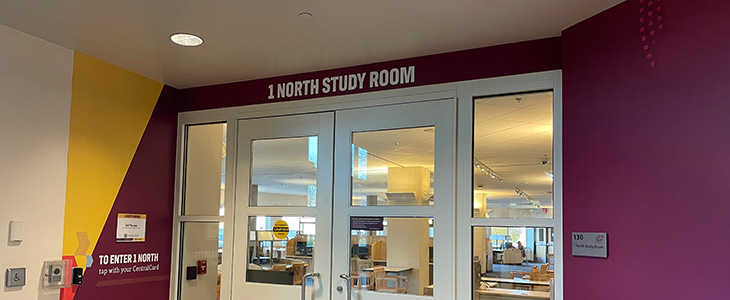
In October 2022, the CMU Libraries contracted with the Occuspace company to install two sensors in the 1 North Study Room. The sensors provide the library with data about usage of the space. We can then determine when the space is most heavily used and when it is lightly used, and we can track patterns of usage across a week or a semester. These observations are then included in larger library discussions about overall usage of the library building and our hours of operation.
The Occuspace sensors rely on Wi-Fi and Bluetooth signals to establish the number of users in the 1 North space at any given time. At no time, however, do they collect personally identifying information from anyone in the room. So, while the library might determine there were seven people in 1 North at some given point, we have no ability to know who those seven individuals are. Protecting privacy is an essential feature of the Occuspace software.
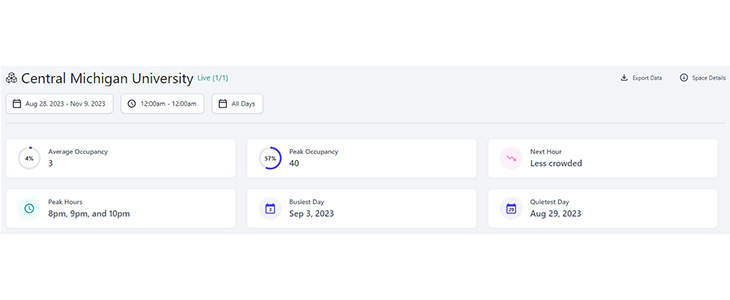
Here are a few Occuspace data points the library uses to assess user traffic in the 1 North study room. These figures reflect user behavior from August 28, 2023 (the first day of the Fall semester) through November 9, 2023. The first image is of the main page dashboard, which provides a quick summary of user activity. From this report we can learn the average occupancy, the peak occupancy, predicted usage (based on previous data) for the next hour, the peak usage hours for our sample period, and the busiest and quietest days so far this semester. Interestingly, the single busiest day was the Sunday of the Labor Day weekend. Though if past data is an indication, 1 North should see even busier days during the upcoming Fall pre-exam and exam weeks in December.
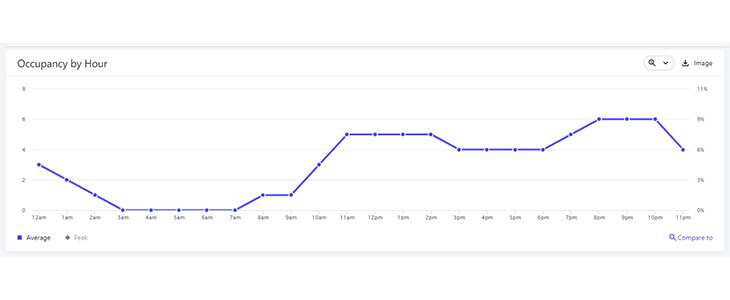
Occuspace also generates helpful, easy-to-read visualizations of usage patterns. The first is a line graph showing usage throughout the 24 hours of the day. From it, you can easily see which are 1 North’s busiest hours. Usage tapers off after midnight, picks up again in later morning, dips a bit in late afternoon, and sees its highest levels after dinner. This pattern is very much in keeping with the traffic we see in the Park Library building throughout the day.
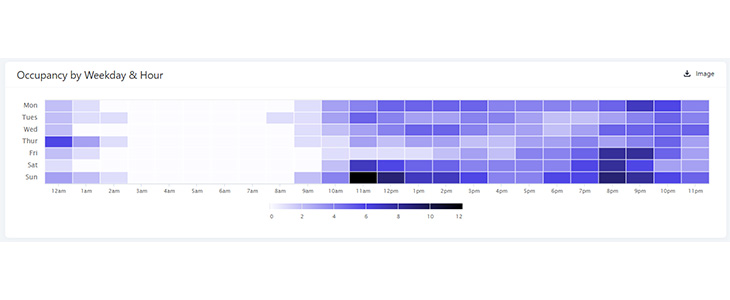
The next image is a heat map, which breaks down the entire week by day and then by hour of the day. On this image, the lighter colors represent lighter usage times while the darker colors show busier times. We see the same pattern identified in the line graph reflected here: Low overnight usage, good usage in the later morning and early afternoon, highest usage in the evenings. A few things from this map are surprising. Friday nights, especially between 8:00 and 10:00 pm, are busy times in 1 North, and Saturday afternoons and evenings tend to be busy, too. We expect Sundays to be busy (it’s a homework day for many students), but it is surprising that Friday and Saturday usage is higher than Tuesdays, Wednesdays, and Thursdays. Be that as it may, we’re always happy to see students using the library.
It’s been interesting to review what the Occuspace sensors have shown us. In some cases, what we learned was expected because it is in keeping with other building usage patterns we’ve observed, but in other cases (e.g. Friday evenings) it gave us unexpected insight into how our space is used. While we only have the sensors in 1 North right now, there has been discussion about possibly placing sensors in other parts of the library, so we can gather more helpful usage data.